
Overview
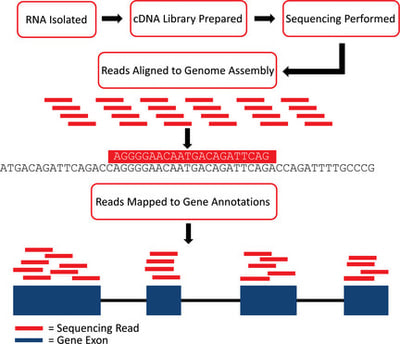
Objective of this course is to introduce you to the general practices for transcriptome data analysis using advanced statistical models. We will use DESeq2 / edgeR / Limma, a Bioconductor packages which are widely used for processing RNASeq read count data. Theses packages support count-based statistical models that expects input data in the form of matrix of raw read counts. This read count matrix after normalization is an approximation of transcript abundance.
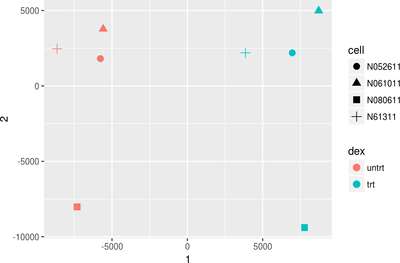
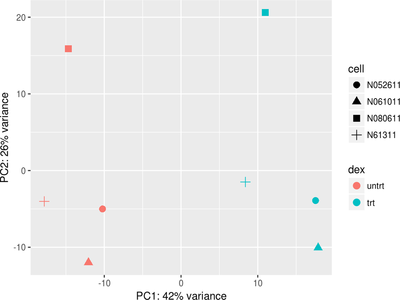
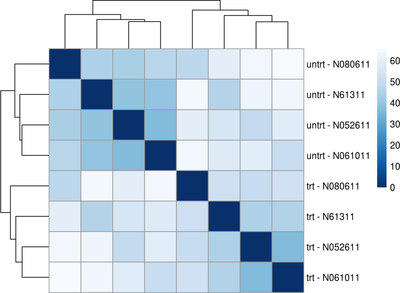
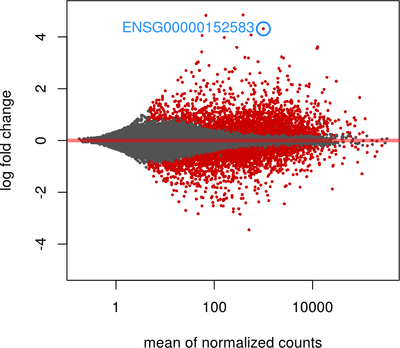
First we will give you a brief introduction to R, RStudio, Bioconductor and RNASeq. Then we proceed to explore bioconductor packages and their various functionalities. We will then start with a case study where we will explore concepts such as data filtering, data normalization methods such as log transformation, VST transformation, higher-dimensional data visualization methods such as PCA, MDS and Heatmap. Next we will explore differential gene expression analysis. In this, we will explore some of the advanced concepts like Effect size estimate, Design contrast, False discovery rate estimation, Multiple testing correction, Batch effects, Surrogate variable analysis and MA plot. Last we will explore annotation resources available in Bioconductor such as AnnotationDbi and org.Hs.eg.db packages followed by Pathway and Gene ontology analysis.
Objective of this course is to introduce you to the general practices for transcriptome data analysis using advanced statistical models. We will use DESeq2 / edgeR / Limma, a Bioconductor packages which are widely used for processing RNASeq read count data. Theses packages support count-based statistical models that expects input data in the form of matrix of raw read counts. This read count matrix after normalization is an approximation of transcript abundance.
First we will give you a brief introduction to R, RStudio, Bioconductor and RNASeq. Then we proceed to explore bioconductor packages and their various functionalities. We will then start with a case study where we will explore concepts such as data filtering, data normalization methods such as log transformation, VST transformation, higher-dimensional data visualization methods such as PCA, MDS and Heatmap. Next we will explore differential gene expression analysis. In this, we will explore some of the advanced concepts like Effect size estimate, Design contrast, False discovery rate estimation, Multiple testing correction, Batch effects, Surrogate variable analysis and MA plot. Last we will explore annotation resources available in Bioconductor such as AnnotationDbi and org.Hs.eg.db packages followed by Pathway and Gene ontology analysis.
|
|
|
Course content
|
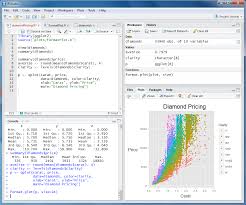
Introduction
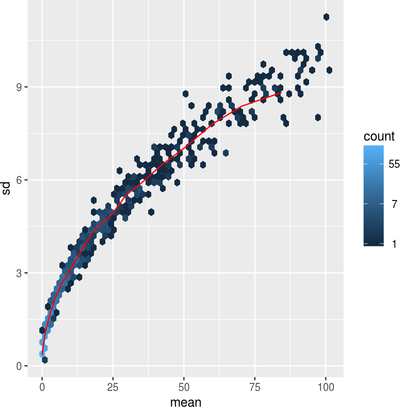
Data Visualization
|
|


Highlights
Duration
Extra Benefits
|
|
Register for this course
Know more about other services
Please fill the Google Form below to know more and register your interest in variety of the services we offer to Empower Education and Research in Life Sciences!
Google Form (Thanks Google!)
Google Form (Thanks Google!)

Inspired By
