
Overview
"A picture is worth ten thousand words" ... Fred R. Barnard
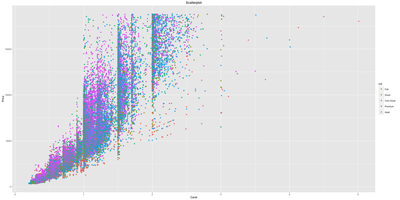
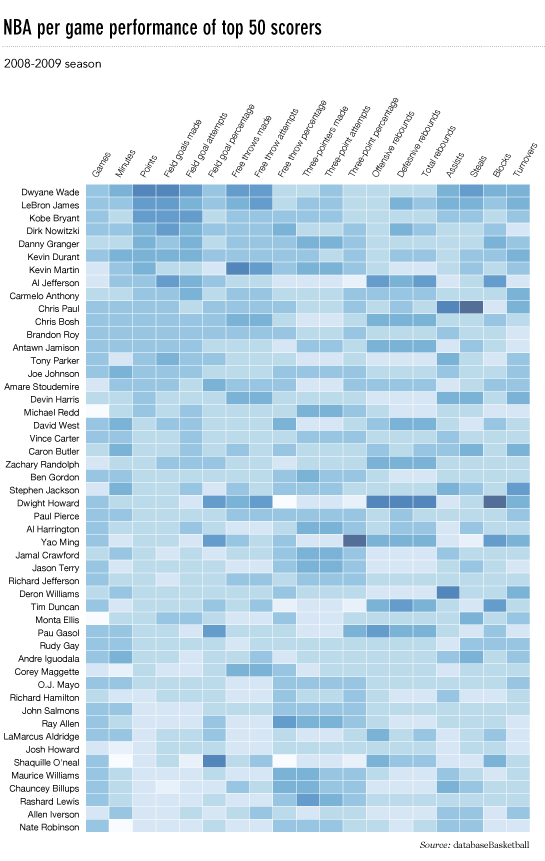
In the world of BIG DATA, deriving actionable insights through convincing observations is the key to Data Science projects. The scientific data visualization through choice of right plots and graphs, thus, play great role in conveying the output of your experiments while submitting manuscripts and reports for publications.
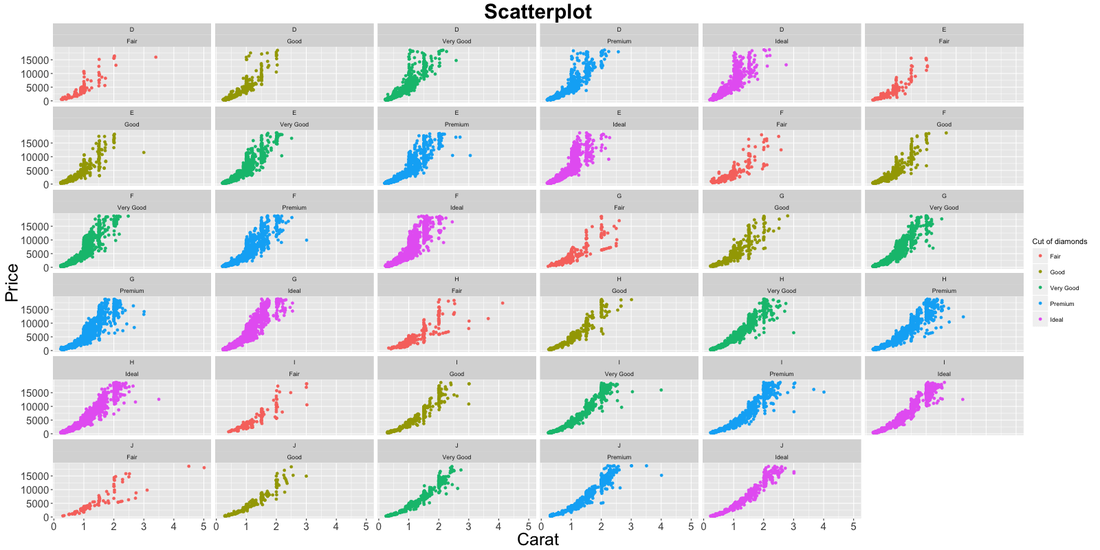
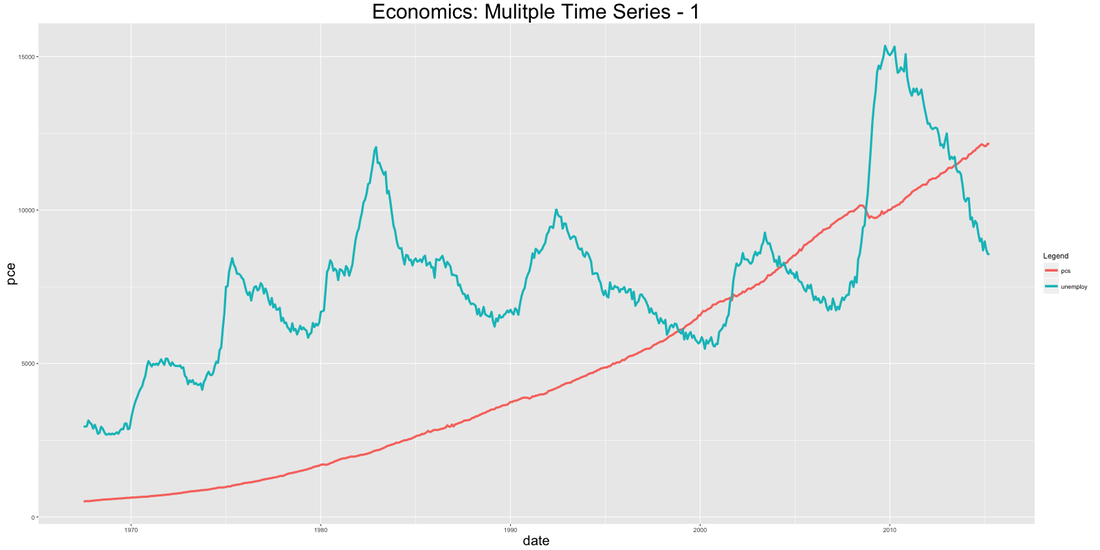
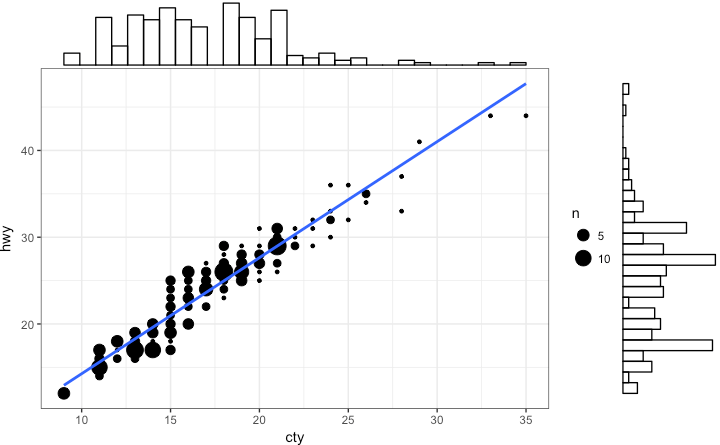
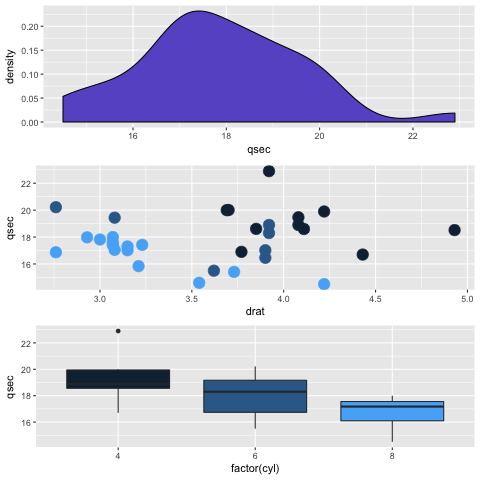
The ggplot2 is one of the widely used data visualization framework developed in R. It has it's own grammar and underlying structure to it. The base graphics plotting is very different from ggplot2 plotting. Once you understand the basic concepts and logic of plotting behind ggplot2, you will be amazed how easy it is to use ggplot2 to make better quality scientific data visualizations.
In the world of BIG DATA, deriving actionable insights through convincing observations is the key to Data Science projects. The scientific data visualization through choice of right plots and graphs, thus, play great role in conveying the output of your experiments while submitting manuscripts and reports for publications.
The ggplot2 is one of the widely used data visualization framework developed in R. It has it's own grammar and underlying structure to it. The base graphics plotting is very different from ggplot2 plotting. Once you understand the basic concepts and logic of plotting behind ggplot2, you will be amazed how easy it is to use ggplot2 to make better quality scientific data visualizations.
|
|
|
Course Content
|
|


Duration
Extra Benefits
|
|
Course fees
|
|
Register for this course
Know more about other services
Please fill the Google Form below to know more and register your interest in variety of the services we offer to Empower Education and Research in Life Sciences!
Google Form (Thanks Google!)
Google Form (Thanks Google!)

Inspired By
