
Simple to Complex Heatmaps in R
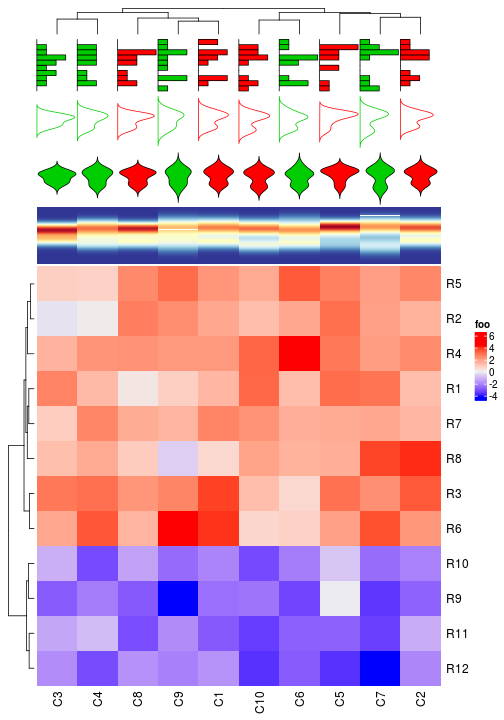
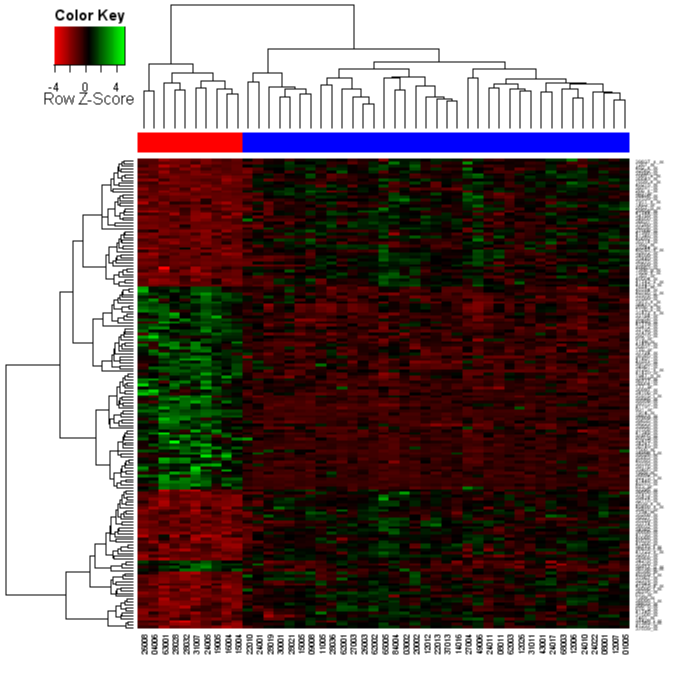
This course aims to train you on drawing heatmaps using R. Course covers simple to advanced heatmap drawing and teach you different tuning parameters to customize heatmaps. Enroll for this mini course on heatmaps.
|
|
|
Course Content
|
|


Duration
Extra Benefits
|
|
|
|
Register for this course
Know more about other services
Please fill the Google Form below to know more and register your interest in variety of the services we offer to Empower Education and Research in Life Sciences!
Google Form (Thanks Google!)
Google Form (Thanks Google!)

Inspired By
- Bioconductor
- R
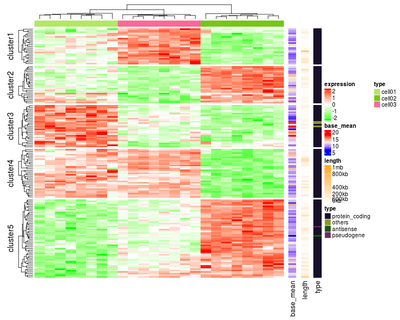
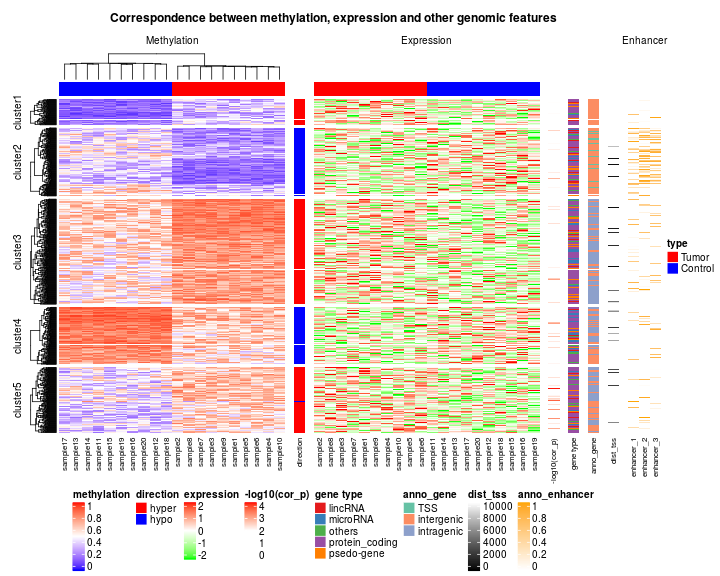
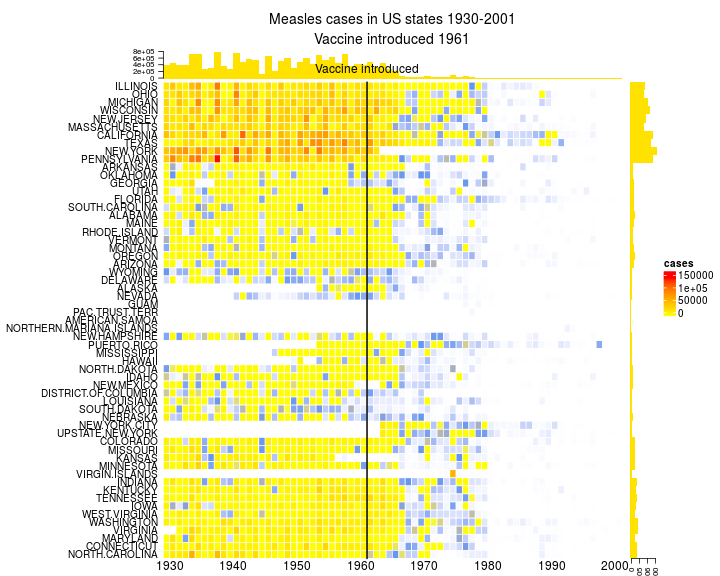
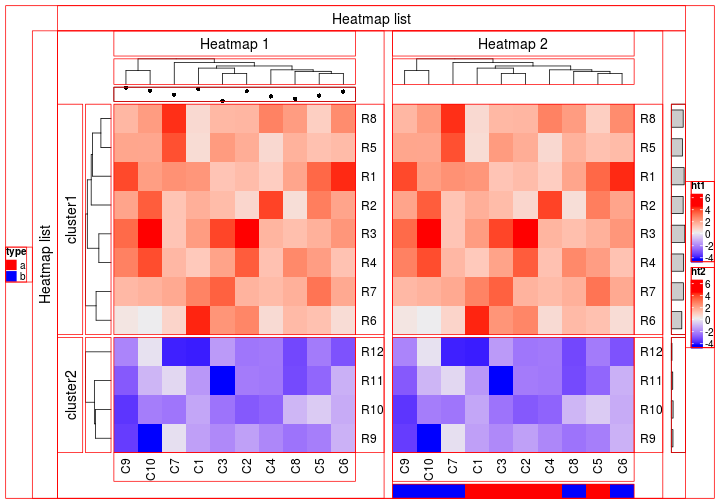
- gplots
- ComplexHeatmap
- pheatmap
- ggplot2
